
Vendor Comparison of EchoGo with Competitor1A using the UK EVAREST Study
EchoGo Performance Testing for FDA-Approval, 2020.

|
Why it matters EchoGo Core provides accurate EF, GLS, and Volumes, and inter-observer variability is zero. This is critical to ensure accurate and precise diagnosis. |
Introduction:
An essential element for building trust in the accuracy and reliability of AI-driven analysis software is the demonstration of agreement between the automated AI assessment and the equivalent assessment produced by qualified cardiac physiologists using the current best practice.
Thus, the aim of this investigation was to evaluate the agreement between metrics of left ventricular function produced Our FDA-approved platform, EchoGo Core, and the equivalent metrics produced by cardiac physiologists using a competitor device.
Methods:
Three qualified cardiac physiologists analysed the transthoracic echocardiograms of 214 patients two times; Once with EchoGo Core and once with a competitor device, operating under current best practice. Physiologists were free to choose the most appropriate images from the apical 2, 3 and 4 chamber views and were blinded to all relevant clinical information in addition to the analysis of the other physiologists.
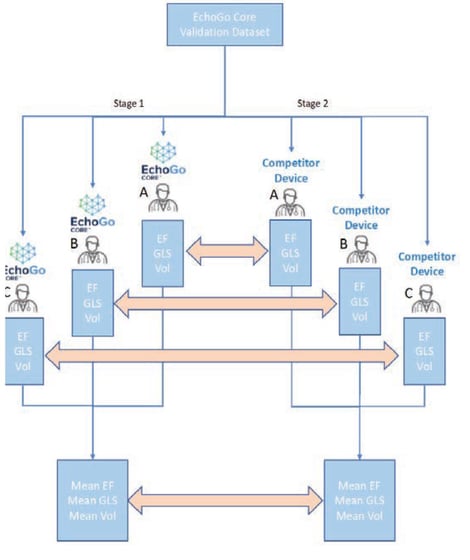
Figure 1. Agreement study design. EF = ejection fraction, GLS = Global Longitudinal Strain, SLS= segmental longitudinal strain, Vol= Volumes.
Data were collected from echocardiography and cardio-oncology clinics from The United Kingdom, The United States of America and Canada, and were acquired according to local clinical protocols using GE (Vivid 7, Vivid E9, Vivid E95) or Philips (iE33, EPIQ 5C, EPIC 7G, EPIQ 7C, EPIC CVx) ultrasound scanners.
Global Longitudinal Strain (GLS) was assessed from the three apical views and was calculated automatically with EchoGo Core, while the competitor device utilised semi-automated speckle tracking with manual corrections where appropriate. 
Volumes and ejection fraction were also calculated using the Simpson’s biplane method. The inter-vendor comparison was conducted on the mean value produced across observers using each device.
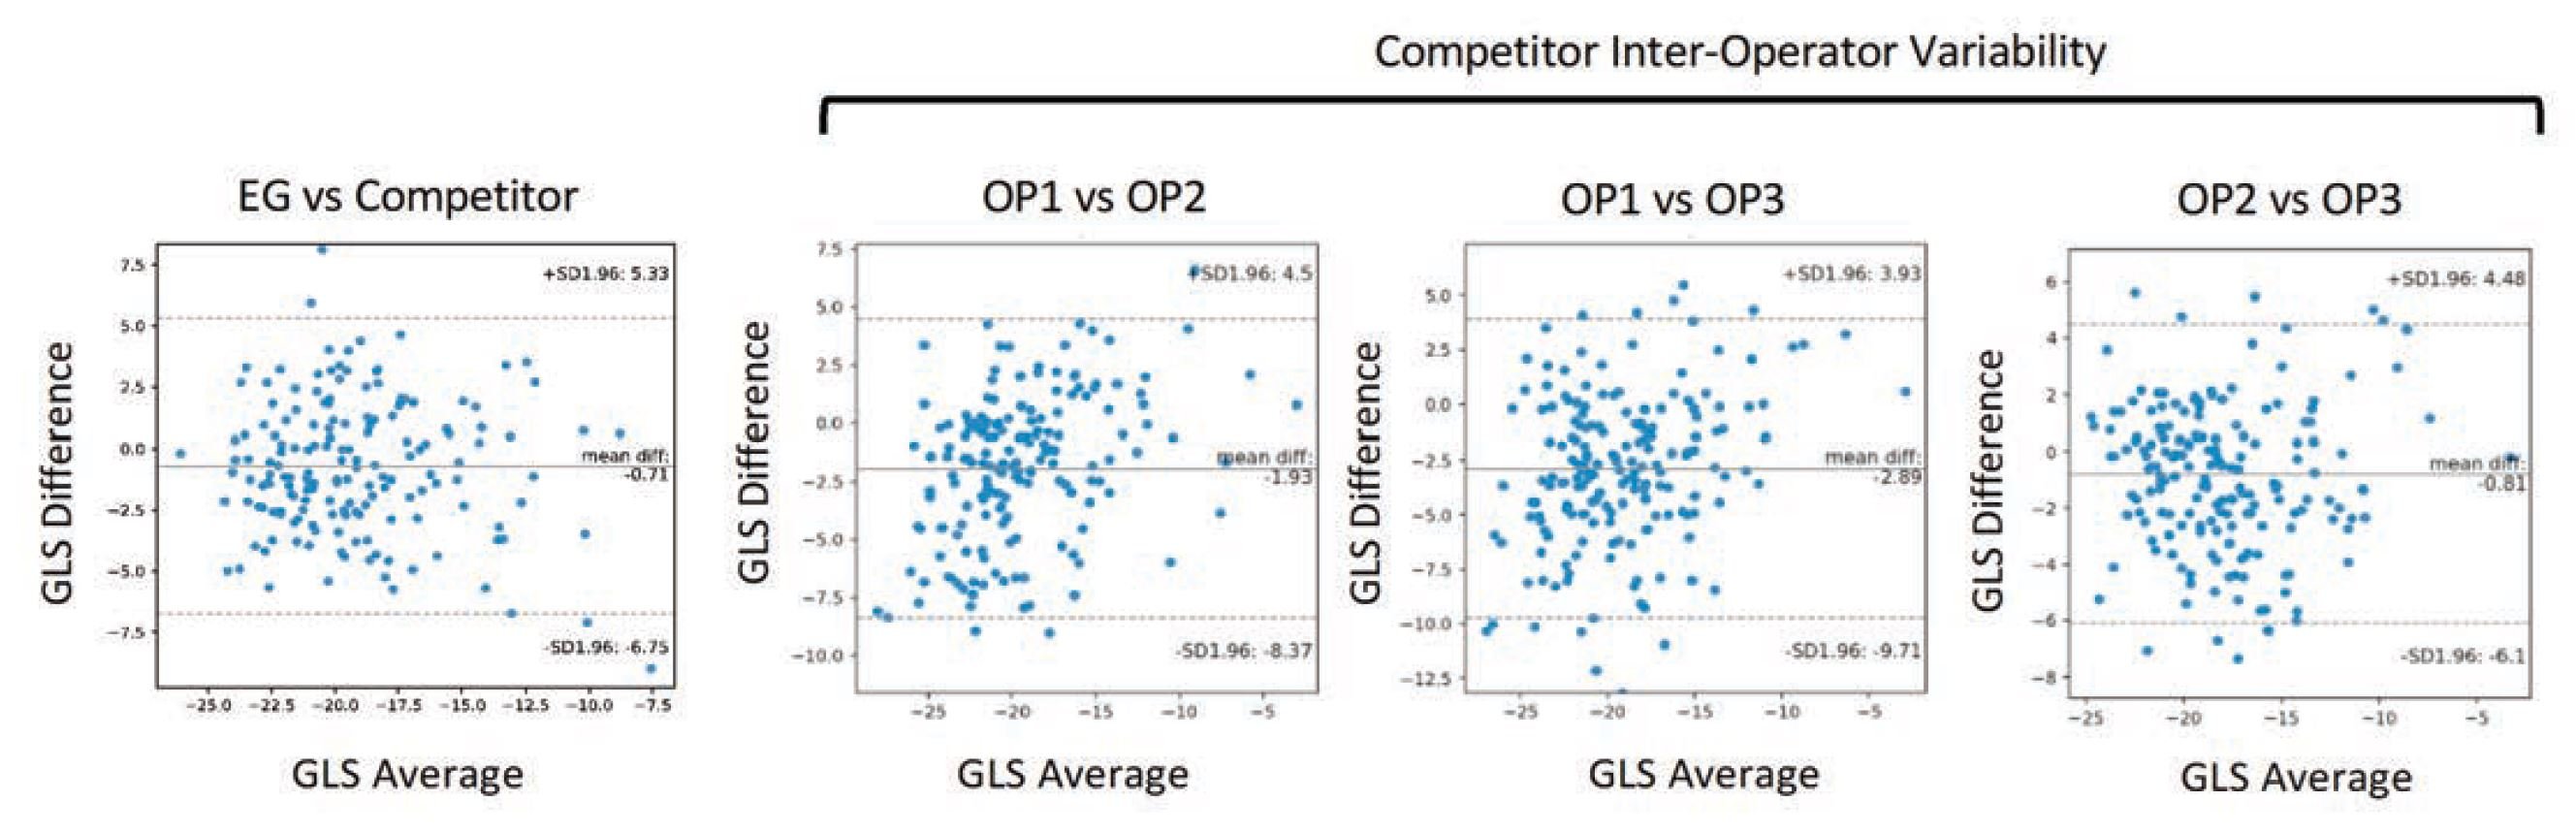
Figure 2. Agreement between EchoGo Core and best current practice with a competitor device. Inter-operator variability with current best practice is also displayed for reference.
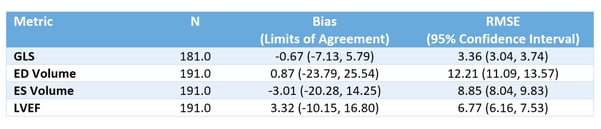
Table 1. Accuracy and agreement of EchoGo Core metrics Vs Competitor device.
Results:
EchoGo Core produced high accuracy for the assessment of GLS, EF and volumes when compared to three qualified cardiac physiologists conducting the same analysis under current best practice, using a competitor device.
Agreement between EchoGo Core and current best practice had lower mean bias and limits of agreement than the observed inter-operator agreement between physiologists using the competitor device. Importantly, being a fully automated device, the inter-observer variability was zero for cases analysed with the same images. Keep reading to learn how EchoGo AI is revolutionizing echocardiography with zero variability results.
Conclusion:
The fully automated analysis conducted by EchoGo Core was comparable to that provides by three qualified operators working under current best practice, when using a competitor device.
With comparable accuracy to current best practice and zero variability when analysing the same images, EchoGo Core can provide a reliable assessment of LV systolic function, with reduced variability and without the requirement for additional clinical time or expertise.